Byron closed 25 homes in July 2026 at a median sale price of $275,000, down from 40 sales at a $291,000 median the month before. Average days on market held at 49, exactly where June landed, meaning the homes that sold moved at the same speed as the prior month. What changed was not how fast the market absorbed inventory. It was how many buyers were in it.
The clearest signal sits in the financing breakdown. FHA-backed purchases, which have historically been Byron's entry point for first-time buyers, fell from 14 closings in June to 6 in July. The FHA buyers who did close came in at a $229,450 median, roughly $45,000 below Byron's overall median and well under the $293,315 FHA median recorded a month earlier.
Byron July 2026 Market Snapshot
The table below compares July 2026 against June 2026 for all residential property types in the Byron reporting area.
Metric | July 2026 | June 2026 | Change |
Homes sold | 25 | 40 | −15 |
Median sale price | $275,000 | $291,000 | −$16,000 |
Average sale price | $299,757 | $297,964 | +$1,793 |
Average days on market | 49 | 49 | No change |
Total dollar volume | $7,493,928 | N/A | N/A |
The divergence between median and average is worth noting. The median fell $16,000 while the average edged up slightly. That pattern indicates a shift in which homes sold rather than broad price decline across the market. Fewer entry-level transactions closed, which pulled the midpoint down, while a handful of higher-priced sales held the average steady.
How Byron Buyers Financed Their Purchases in July 2026
Loan type is the most revealing data point in a month this size, because it identifies which buyer pools are actually transacting and which have stepped back.
Loan type | Sales | Median price | Avg. DOM |
Conventional | 12 | $294,500 | 40 |
FHA | 6 | $229,450 | 56 |
Cash | 4 | $279,450 | 37 |
VA | 3 | $410,000 | 84 |
Total | 25 | $275,000 | 49 |
Conventional financing accounted for just under half of all Byron closings and posted the highest transaction count by a wide margin. Cash buyers moved fastest at 37 average days on market, which is typical given that cash purchases skip appraisal and underwriting timelines.
A note on sample size. The VA and cash categories each represent fewer than five transactions. Figures that thin describe the specific homes that closed rather than a reliable market characteristic, and they should be read as directional only. The VA median of $410,000 reflects three particular properties, not a claim that VA buyers in Byron are shopping at that level.
Why the FHA drop is the story of the month
Byron has functioned as one of the more accessible markets in the greater Houston County area, and FHA financing has been the mechanism that made it accessible. In June, FHA accounted for 14 of 40 closings at a $293,315 median. In July, that fell to 6 of 25 at a $229,450 median.
Two things happened simultaneously: fewer FHA buyers closed, and the ones who did bought materially less expensive homes. A roughly $64,000 drop in the FHA median inside a single month points toward affordability pressure at the entry level rather than a change in what Byron is worth. Buyers using FHA financing appear to be shopping a lower price band than they were 30 days earlier.
Byron Straddles Two Counties, and They Do Not Price the Same
Byron is unusual among Middle Georgia markets because its reporting area spans both the Peach County side and the Watson Boulevard North corridor. In July those two areas produced meaningfully different results.
Area | Sales | Median price | Avg. price | Avg. DOM |
Peach County | 16 | $298,450 | $330,333 | 46 |
All Watson Blvd. North | 9 | $263,900 | $245,400 | 53 |
Combined | 25 | $275,000 | $299,757 | 49 |
The Peach County side carried nearly two-thirds of July's transaction volume and posted a median roughly $34,550 higher than the Watson Boulevard North side. It also moved slightly faster at 46 average days on market against 53. For anyone comparing Byron listings, the county line is a real variable in what a given price point buys.
Active Inventory in Byron, GA
At the close of July, Byron carried 73 active residential listings representing $24,098,868 in aggregate asking price. Single-family detached homes made up the overwhelming majority.
Property type | Active listings | Median asking | Avg. DOM |
Single-family detached | 62 | $298,500 | 77 |
Townhouse | 7 | $247,312 | 98 |
Manufactured home | 3 | $187,500 | 25 |
Mobile home | 1 | $110,000 | 20 |
Total active | 73 | N/A | N/A |
The single-family detached median asking price of $298,500 sits within roughly $3,500 of the $295,000 median that detached homes actually sold for in July. That is an unusually tight gap and suggests Byron sellers are broadly pricing in line with what the market is paying.
The gap that does exist is in time, not price. Active single-family listings averaged 77 days on market against 52 days for those that sold. Townhouses show the widest spread at 98 average days across seven active listings, which is a thin enough segment that it should be watched rather than treated as a trend.
I'm Selling in Byron: Do I Need to Lower My Price?
Not necessarily, and the July data argues against a reflexive price cut. Byron's median asking price for single-family detached homes and its median sold price are within about $3,500 of each other, and average days on market held flat at 49 rather than lengthening. Those are not the conditions that call for across-the-board reductions.
What changed in July was the composition of the buyer pool, not the market's willingness to pay. FHA activity contracted sharply while conventional financing held. For a seller, that distinction matters because it determines who is likely to write on your home rather than whether anyone will.
Here is where I would focus a Byron seller right now. If your home sits at or below roughly $250,000, you have historically been marketing to FHA buyers, and that pool thinned considerably in July. That is a reason to make sure the property will clear FHA minimum property requirements on inspection, because a repair callback in a thin buyer pool costs you more than it would in a deep one. If your home sits above $290,000, conventional buyers carried July, and your positioning is comparatively stable.
I would also pay attention to which side of the county line your home sits on. The Peach County side posted a $298,450 median against $263,900 on the Watson Boulevard North side, and pricing a home against the wrong half of that spread is one of the more common errors I see in this market.
I'm Buying in Byron: What Should I Do Right Now?
Byron in July 2026 offered buyers 73 active listings against 25 monthly closings, which is roughly a three-month supply and closer to balanced conditions than the seller-favored market of recent years. Active single-family listings averaged 77 days on market, meaning a meaningful share of available homes have been sitting long enough that sellers may be open to negotiation.
For buyers using FHA financing specifically, July's data cuts both ways. Fewer FHA buyers transacted, which means less competition from others in your financing category. At the same time, the homes that closed FHA came in at a $229,450 median, which reflects the price band where FHA buyers are finding workable properties.
My practical guidance for a Byron buyer is to widen the search across the county line rather than anchoring to one side. A $275,000 budget reaches different housing stock depending on whether you are looking on the Peach County side or the Watson Boulevard North corridor, and buyers who only search one tend to conclude the market has nothing for them when it does.
I would also get fully underwritten rather than pre-qualified before writing. In a month where 20 of 25 sales were co-op transactions averaging 61 days on market, sellers have time to evaluate offers carefully, and a strong file is what separates competing bids when price is close.
Frequently Asked Questions About the Byron, GA Housing Market
What is the median home price in Byron, GA?
The median sale price in Byron, Georgia was $275,000 in July 2026, based on 25 residential closings reported through Central Georgia MLS. That figure is down from $291,000 in June 2026, a decrease of roughly $16,000 month over month. The average sale price for the same period was $299,757, and the gap between median and average reflects a small number of higher-priced transactions pulling the average upward. Buyers and sellers evaluating Byron GA home prices should note that the median varies noticeably depending on which side of the Peach County line a property sits on.
How long does it take to sell a house in Byron, GA?
Homes that sold in Byron, Georgia in July 2026 averaged 49 days on market, unchanged from June 2026. Single-family detached homes specifically averaged 52 days, while active listings that had not yet sold were averaging 77 days on market. Days on market in Byron varies significantly by financing type, with cash purchases closing in an average of 37 days and VA-financed purchases averaging 84 days. Sellers planning a move should budget for roughly two months from listing to closing under current Byron GA market conditions, plus additional time for the closing process itself.
Is Byron, GA a buyer's market or a seller's market in 2026?
Byron, Georgia was operating close to balanced conditions in July 2026, with 73 active listings against 25 monthly closings, which works out to approximately three months of supply. Markets with under three months of inventory generally favor sellers, while markets above six months favor buyers, placing Byron near the neutral line. The unusually narrow gap between the median asking price of $298,500 and the median sold price of $295,000 for detached homes suggests Byron sellers are pricing realistically. Buyers do have leverage on listings that have been sitting well beyond the 49-day average.
Why did FHA home sales drop in Byron, GA?
FHA-financed purchases in Byron, Georgia fell from 14 closings in June 2026 to 6 in July 2026, and the median price for FHA transactions dropped from $293,315 to $229,450 over the same period. The data itself does not identify a cause, but the combination of fewer transactions and a substantially lower price point is consistent with affordability pressure at the entry level rather than a decline in Byron property values. FHA loans typically serve first-time and lower-down-payment buyers, so contraction in that category disproportionately affects the entry-level segment of the Byron GA housing market. A single month is a signal to monitor rather than an established trend.
What is the difference between the Peach County and Houston County sides of Byron?
The Byron, Georgia MLS reporting area spans both Peach County and the Watson Boulevard North corridor, and the two priced differently in July 2026. The Peach County side recorded 16 sales at a $298,450 median with 46 average days on market, while the Watson Boulevard North side recorded 9 sales at a $263,900 median with 53 average days on market. That is a difference of roughly $34,550 in median sale price within the same broader market. Property taxes, school attendance zones, and municipal services can also differ across the county line, so buyers comparing Byron GA homes for sale should confirm which jurisdiction a specific address falls in.
How much inventory is available in Byron, GA right now?
Byron, Georgia carried 73 active residential listings at the close of July 2026, representing $24,098,868 in total asking price. Single-family detached homes accounted for 62 of those listings with a median asking price of $298,500 and an average of 77 days on market. The remaining inventory consisted of 7 townhouses at a $247,312 median, 3 manufactured homes at a $187,500 median, and 1 mobile home at $110,000. Buyers searching for homes for sale in Byron GA should be aware that the townhouse and manufactured segments are thin enough that availability changes quickly.
Are home prices falling in Byron, GA?
The median sale price in Byron, Georgia declined from $291,000 in June 2026 to $275,000 in July 2026, but that movement should not automatically be read as depreciation. The average sale price actually rose slightly over the same period, from $297,964 to $299,757, which indicates the median shifted because of a change in which homes sold rather than a broad reduction in property values. When fewer entry-level transactions close, the midpoint of the data set moves down even if individual home values are stable. Assessing true appreciation in the Byron GA real estate market requires comparing similar properties over a longer horizon than a single month.
What can I buy in Byron, GA for $275,000?
A $275,000 budget sat right at the July 2026 median sale price in Byron, Georgia, meaning it would have reached roughly half the homes that closed that month. On the Watson Boulevard North side, where the median was $263,900, that budget positions a buyer above the midpoint and expands available options. On the Peach County side, where the median was $298,450, the same budget sits below the midpoint and narrows the field considerably. Buyers working with a $275,000 budget in Byron GA generally find more selection by searching both sides of the county line rather than restricting to one.
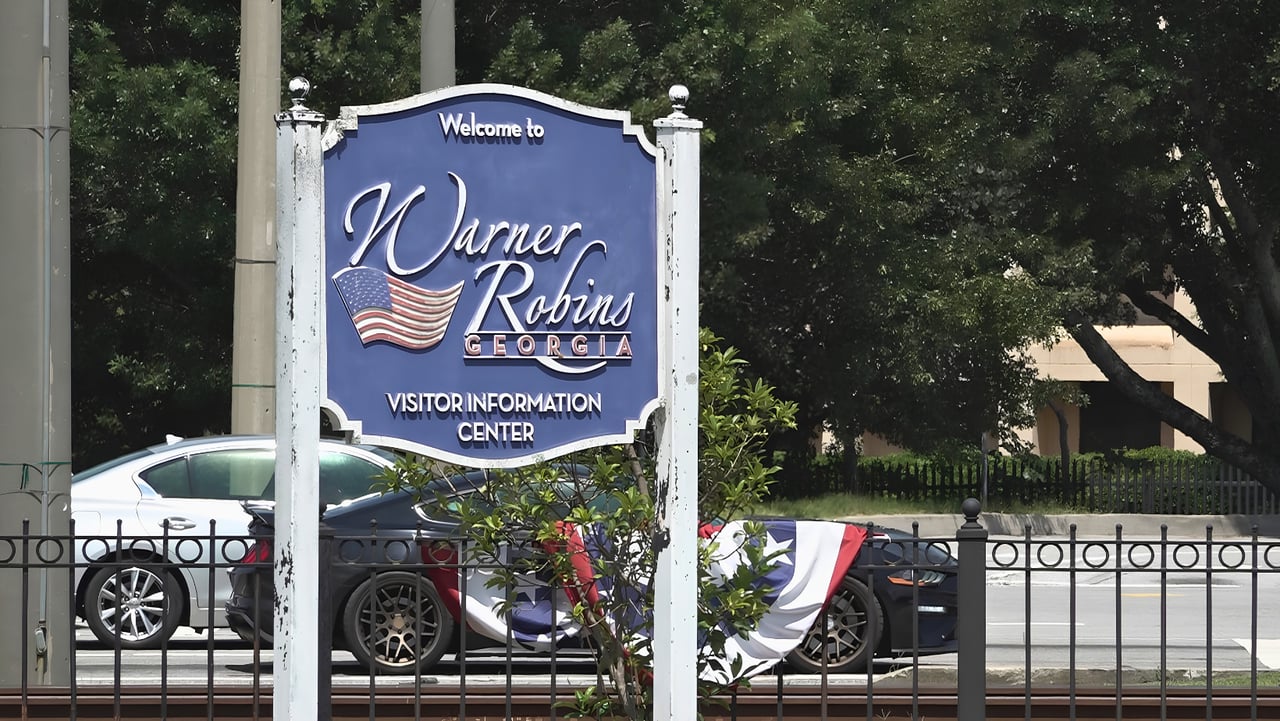
How does Byron, GA compare to Warner Robins for home buyers?
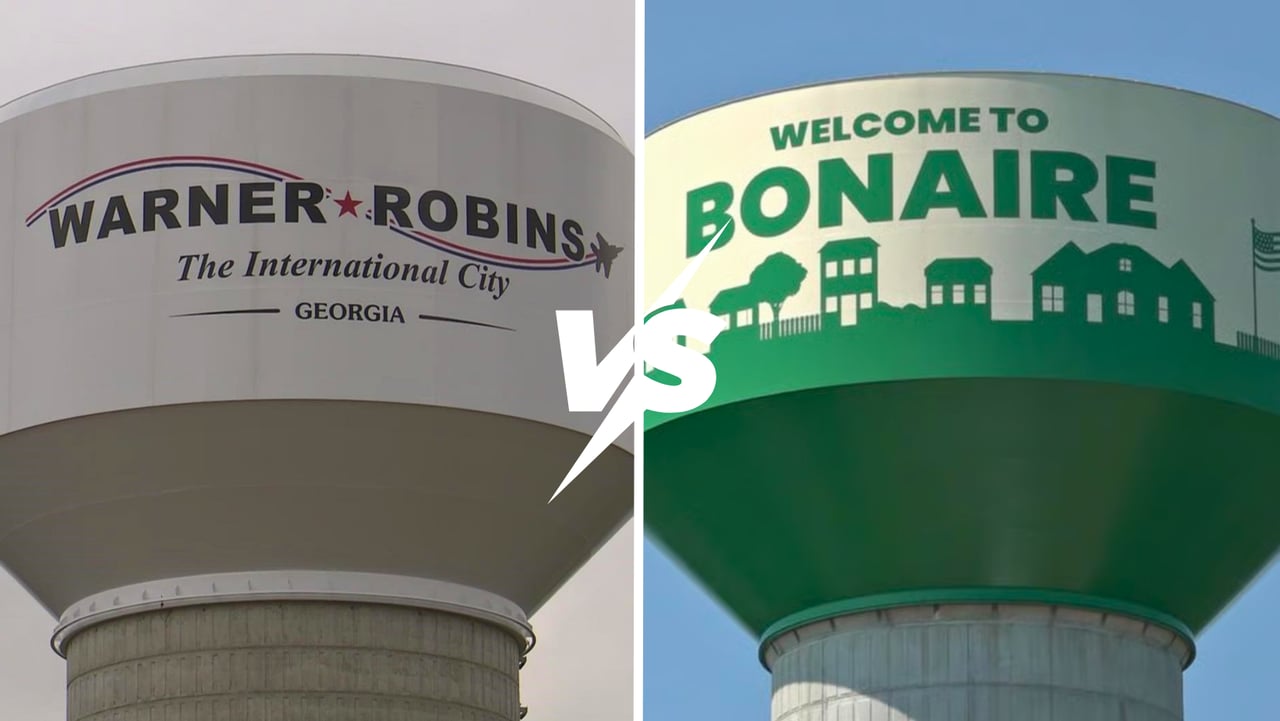
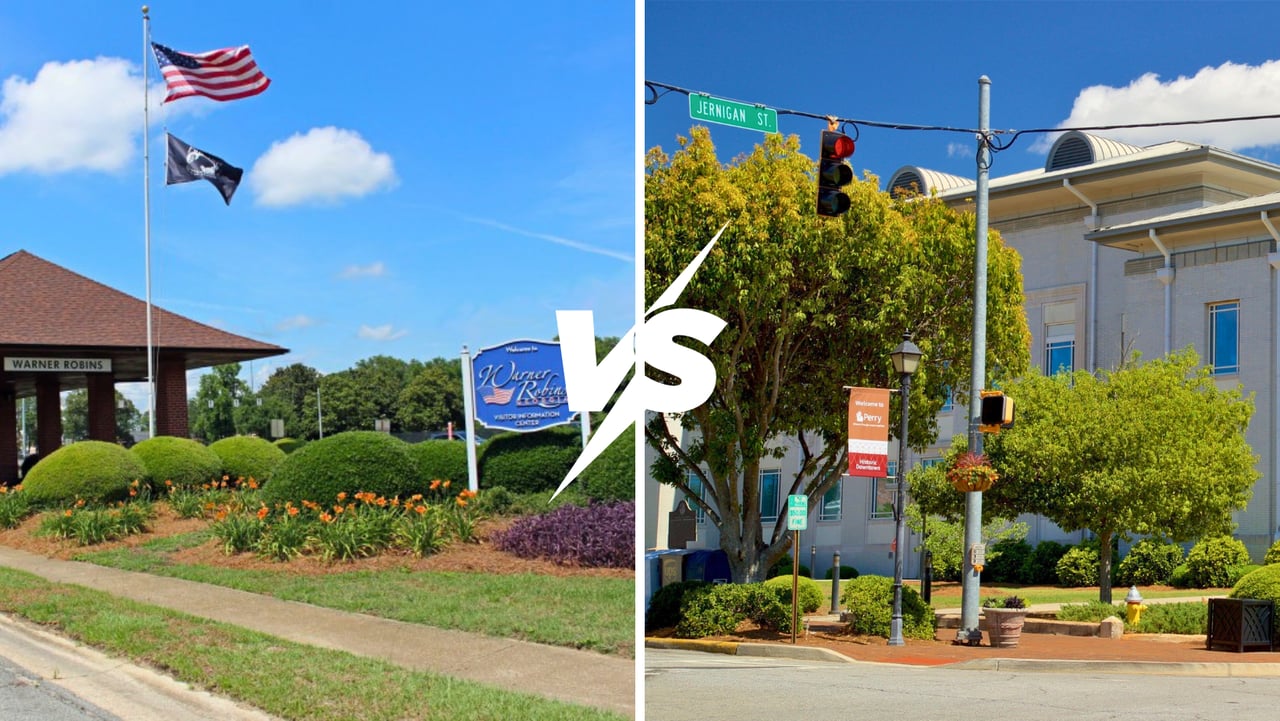
Byron, Georgia posted a $275,000 median sale price in July 2026 with 25 closings and 49 average days on market, while Warner Robins posted a $255,000 median across 84 closings with 36 average days on market. Warner Robins offers considerably more transaction volume and faster absorption, which generally means more inventory turnover and more comparable sales to price against. Byron carries a higher median price point but a smaller and less liquid market. Buyers relocating to the Robins Air Force Base area often compare the two on commute time, school attendance zones, and lot size rather than price alone.
Do VA loans work well in the Byron, GA market?
VA-financed purchases accounted for 3 of 25 residential closings in Byron, Georgia in July 2026, a smaller share than in nearby Warner Robins or Bonaire where proximity to Robins Air Force Base drives higher VA volume. With fewer than five transactions, the July VA figures for Byron describe specific properties rather than a reliable market characteristic. VA loans remain fully usable in Byron and carry the same benefits statewide, including no down payment requirement and no private mortgage insurance. Service members and veterans considering Byron GA homes should evaluate commute distance to the base alongside price, since Byron sits farther out than the closer-in Houston County markets.
What are the property taxes like in Byron, GA?
Property tax rates in Byron, Georgia depend on which county a specific parcel falls within, since the Byron market area spans both Peach County and the Houston County side along the Watson Boulevard North corridor. Georgia assesses property at 40 percent of fair market value, and the applicable millage rate is then applied to that assessed value, with one mill representing one dollar of tax per one thousand dollars of assessed value. Houston County adopts its millage rates in August each year, and municipal and school district rates are set separately from the county rate. Buyers comparing Byron GA properties should verify the exact taxing jurisdiction for any address before estimating a monthly payment.
When is the best time to sell a house in Byron, GA?
Byron, Georgia recorded 40 closings in June 2026 against 25 in July 2026, which reflects the typical late-spring and early-summer concentration of activity common across Middle Georgia markets. Listing ahead of that window generally exposes a property to the largest pool of active buyers, particularly families timing a move around the school calendar. That said, average days on market in Byron held steady at 49 days in both June and July, meaning homes were not sitting longer as volume declined. Sellers in the Byron GA housing market should weigh their own timeline and the specific price band their home occupies rather than relying on seasonality alone.
This market update reflects July 2026 closed data and is refreshed quarterly. For the most current Byron, GA figures, refer to the most recent monthly update.
About the Author
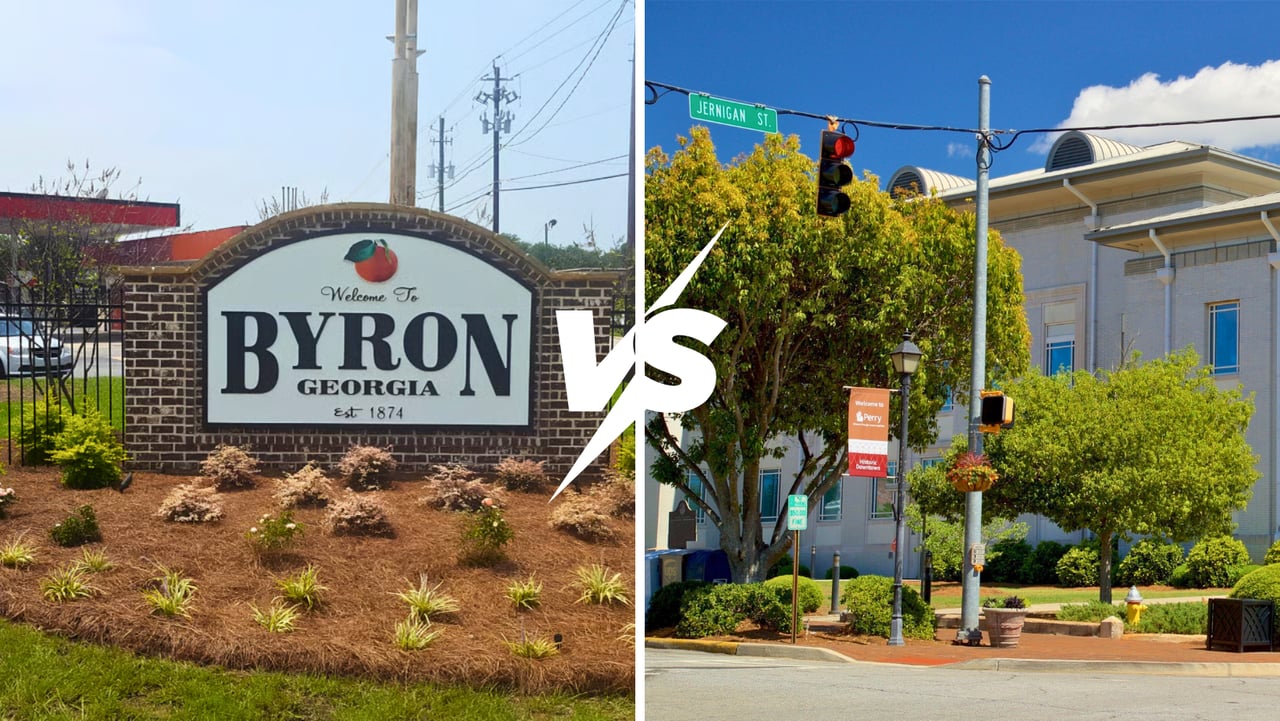
William Walton-Dean is a licensed REALTOR® with Walton Dean Realty, operating under Real Broker LLC, serving buyers and sellers across Houston County, Georgia, including Perry, Warner Robins, Bonaire, Kathleen, Byron, and the surrounding Middle Georgia housing market. Known for a data-driven, hyper-local approach and deep expertise in the military and PCS relocation market around Robins Air Force Base, he helps buyers and sellers at every price point make clear, confident decisions backed by real market insight.
📱 478-371-7069
Walton Dean Realty | Real Broker LLC
Buying or Selling in Byron? Let's Talk.
Byron's market splits across two counties and two very different price pictures, and the right strategy depends on which side of that line your property sits on. Whether you are pricing a home to sell or trying to understand what your budget actually reaches here, I can walk you through the current numbers for your specific area.
William Walton-Dean | Walton Dean Realty
📱 478-371-7069
A More Strategic Approach to Real Estate
Disclaimer: This post is for informational purposes only and does not constitute financial, legal, or tax advice. Market data reflects closed transactions reported through Central Georgia MLS for July 2026 and is subject to revision. Individual property values vary. Always consult a licensed professional before making real estate decisions.